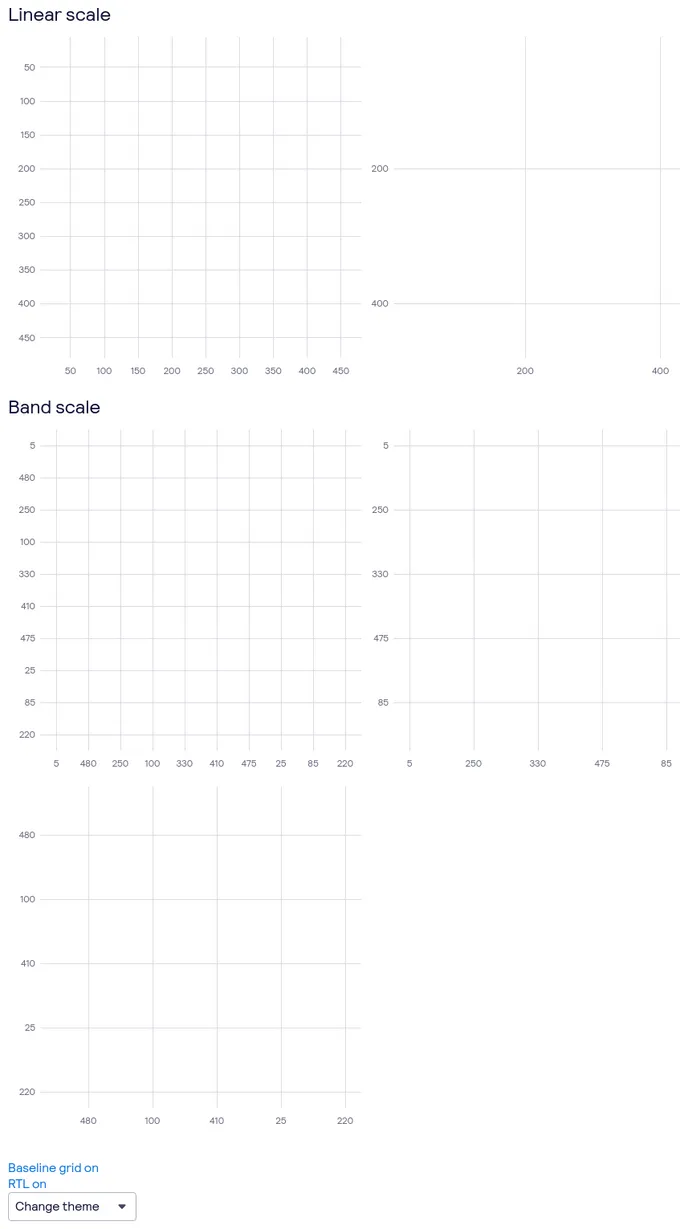
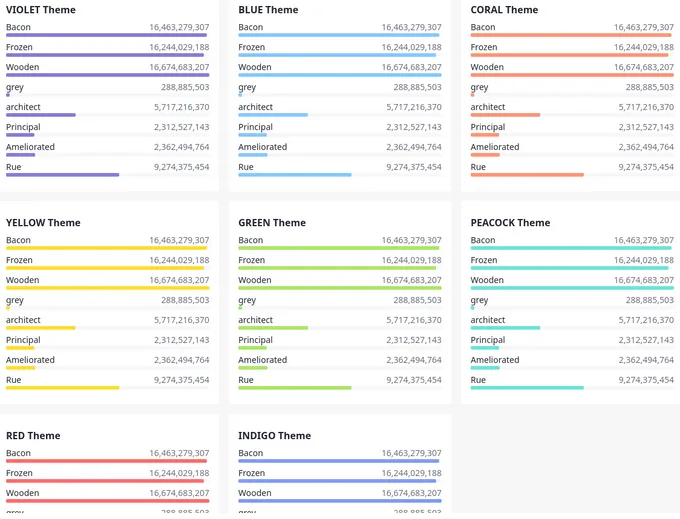
Sass chart components
16 charts are styled using Sass. A chart is a graphical representation of data. A chart visualizes large sets of information to help users understand trends and relationships between data points. Sass is a styling format that is compiled into CSS. It extends CSS with advanced features like scripting, mixins, and nesting. Sass is used to style 16 projects.
16components30storiesLast updated last month
Other Names
bpk-component-barchart

Dynamic Chart


TreeMapChart

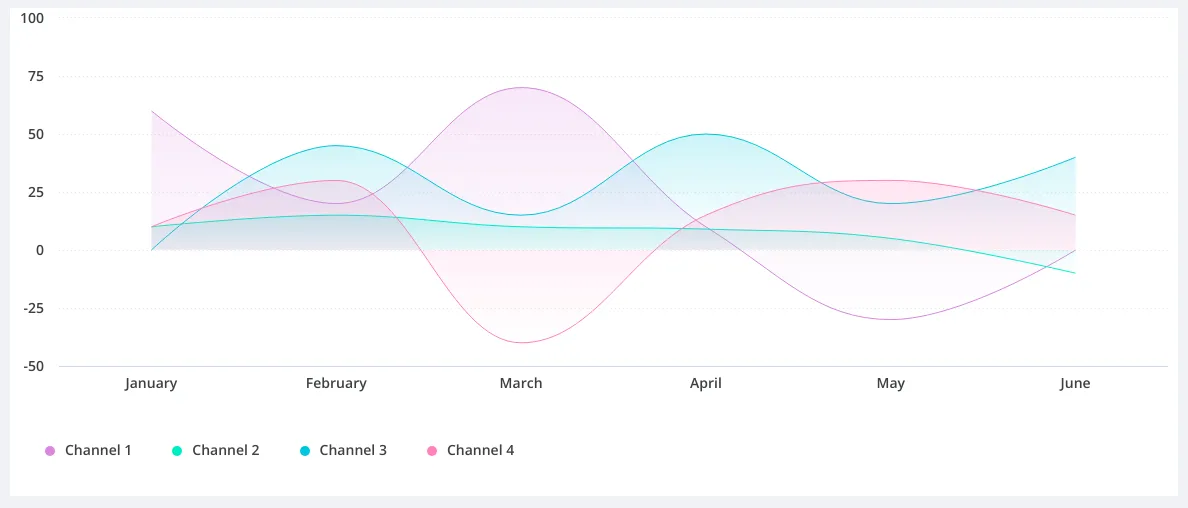
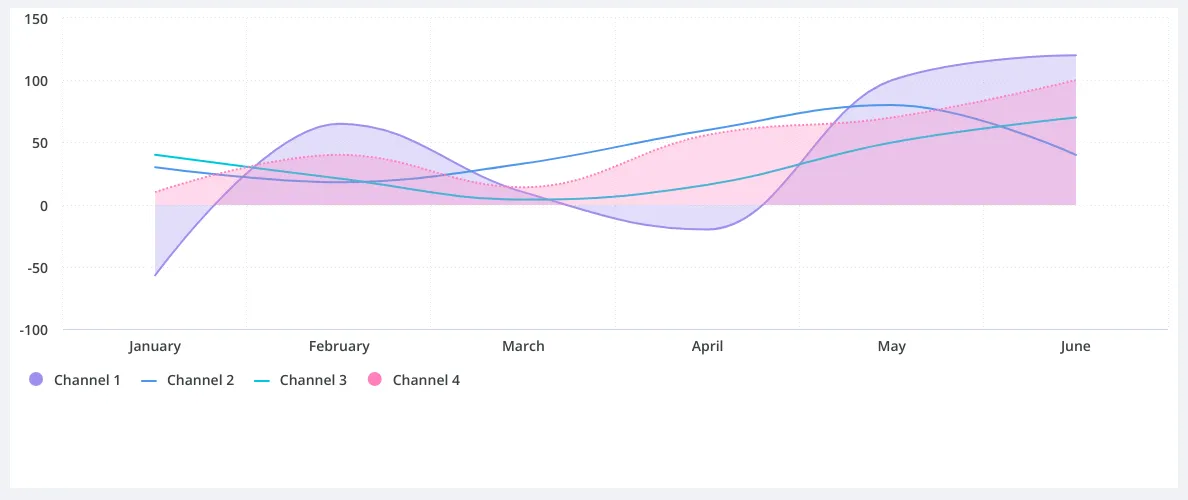
AreaChart
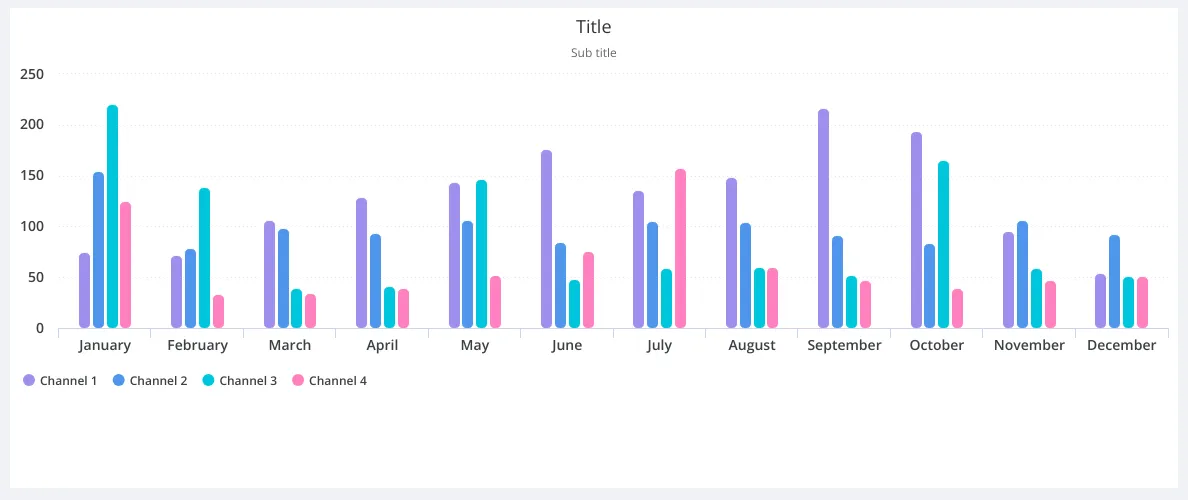
BarChart
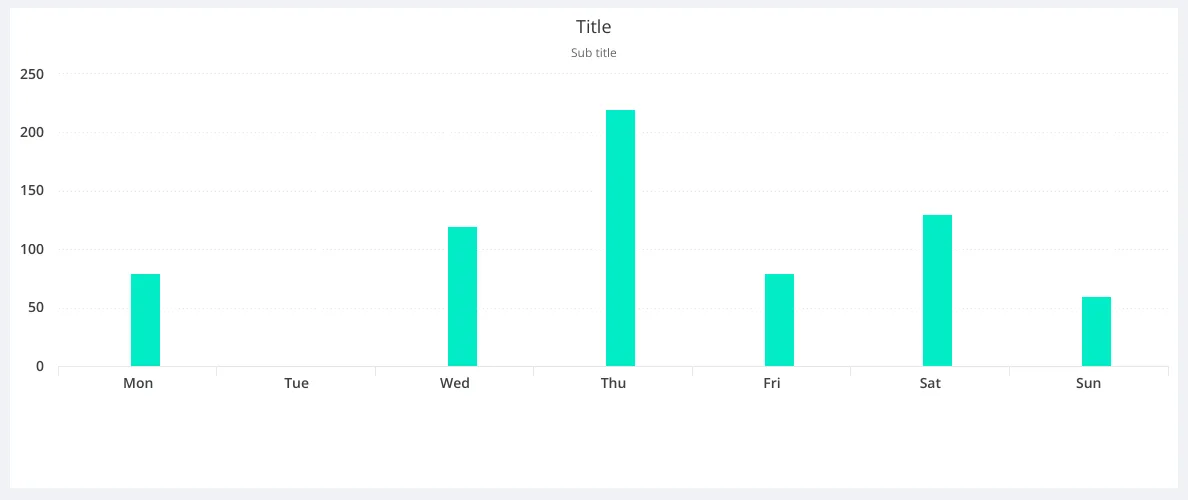
ColumnChart
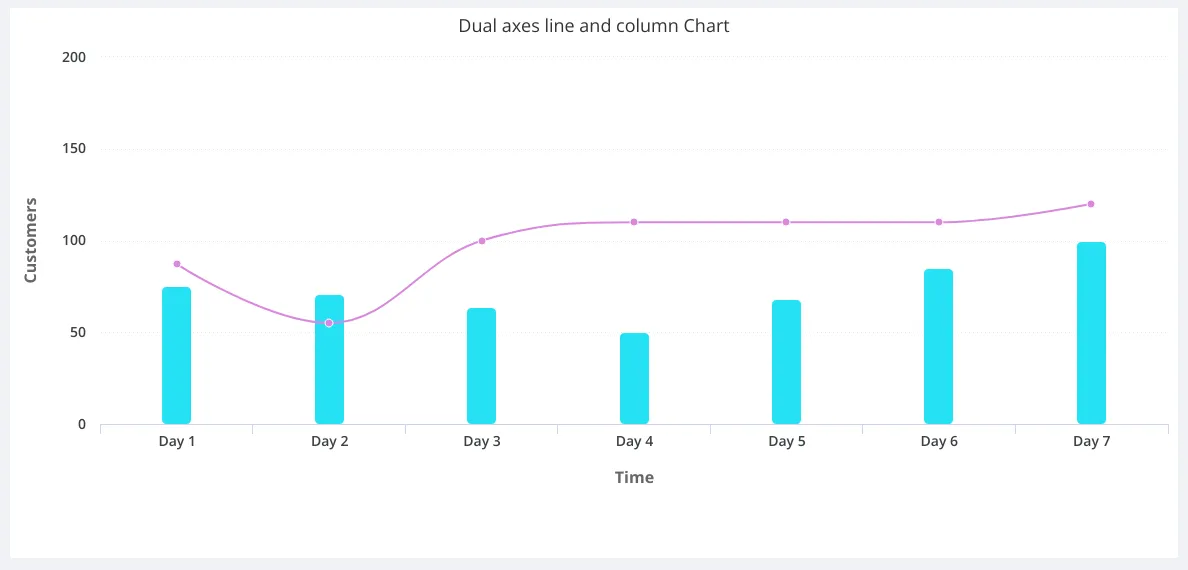
DalColumnChart
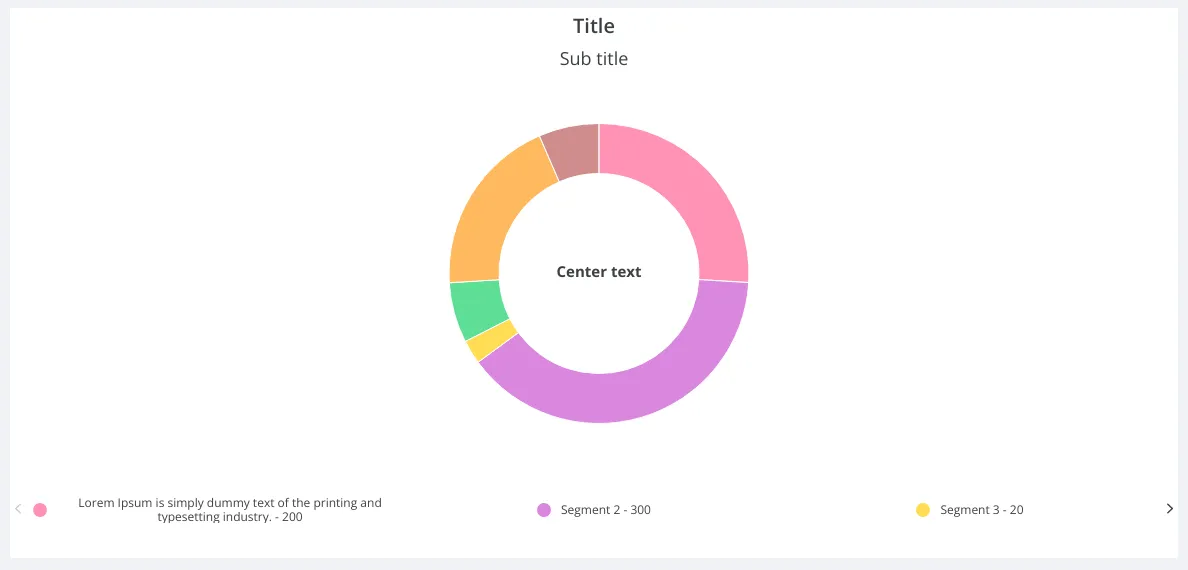
DonutChart
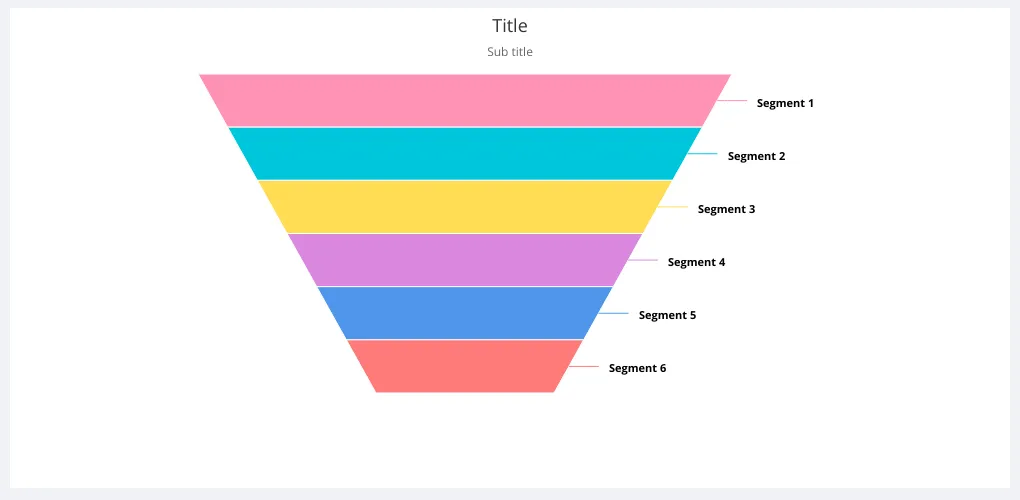
FunnelChart
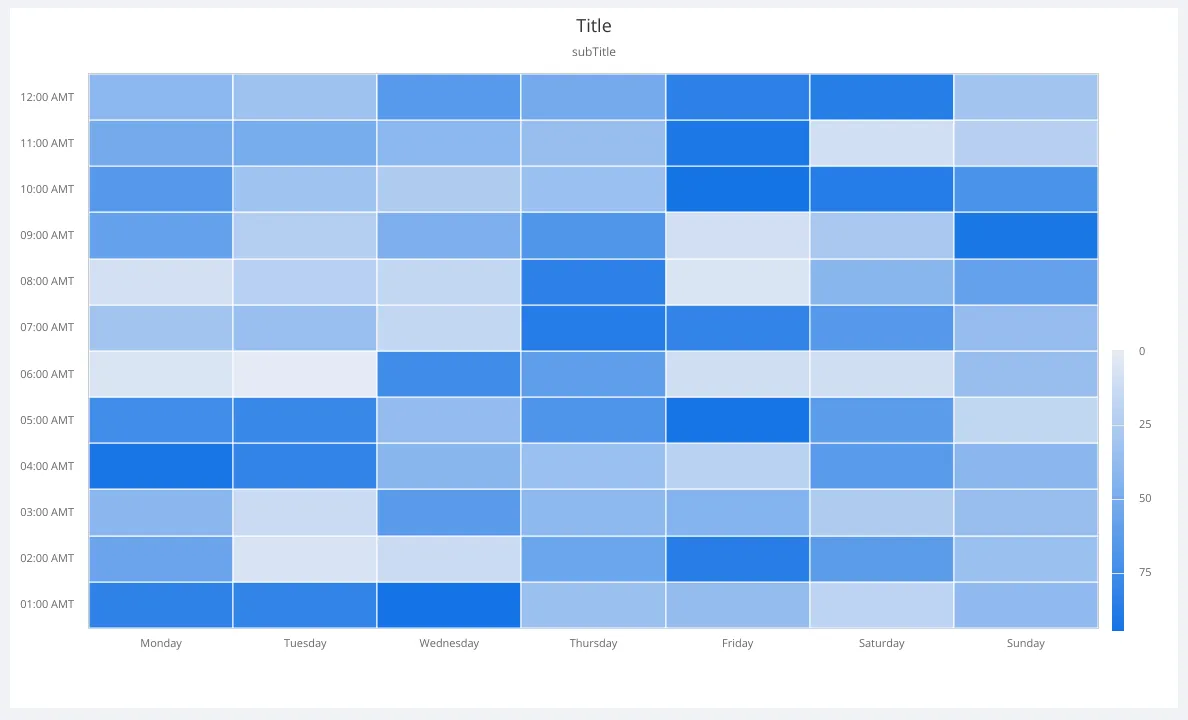
HeatMapChart
LineChart
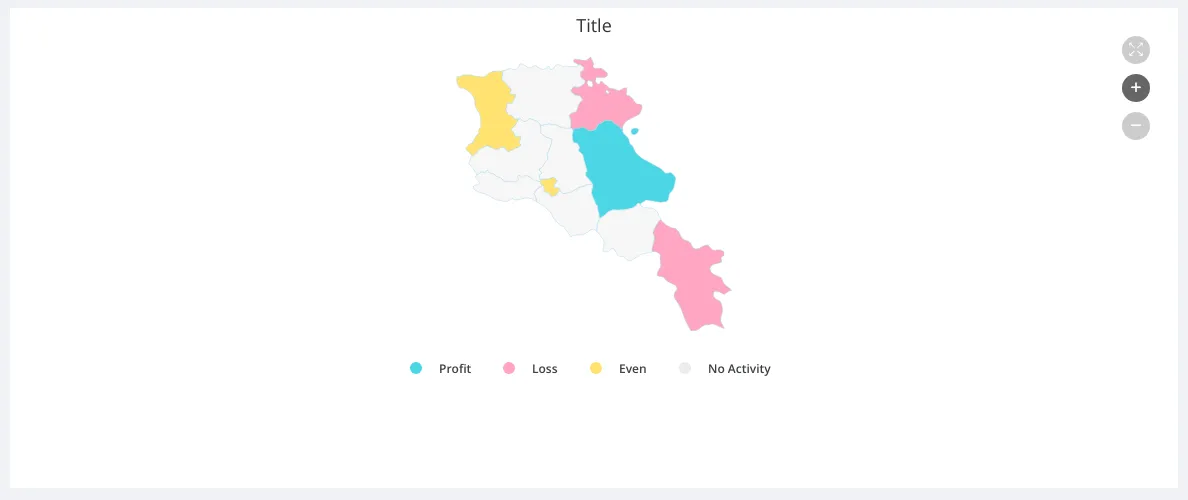
MapChart
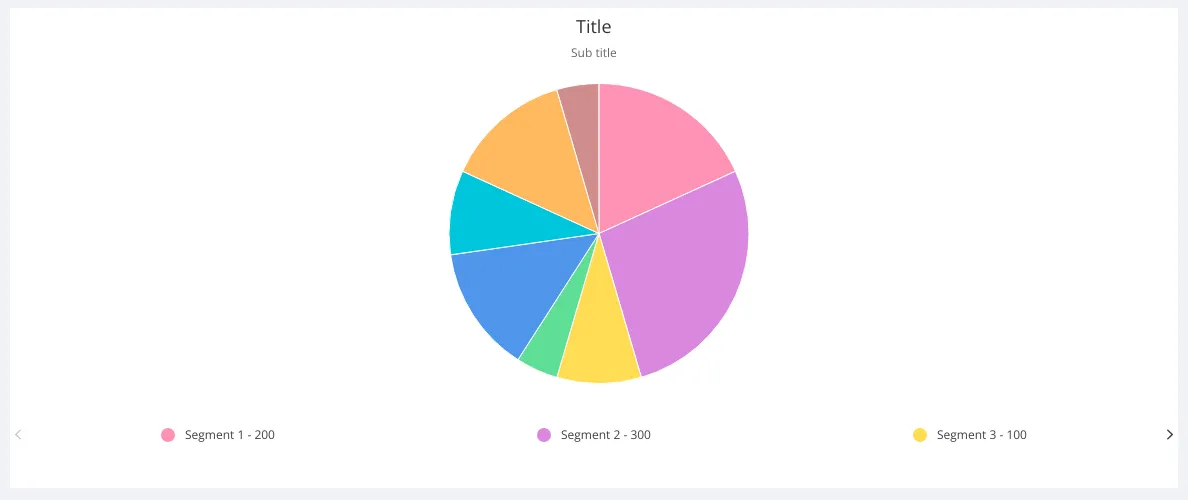
PieChart
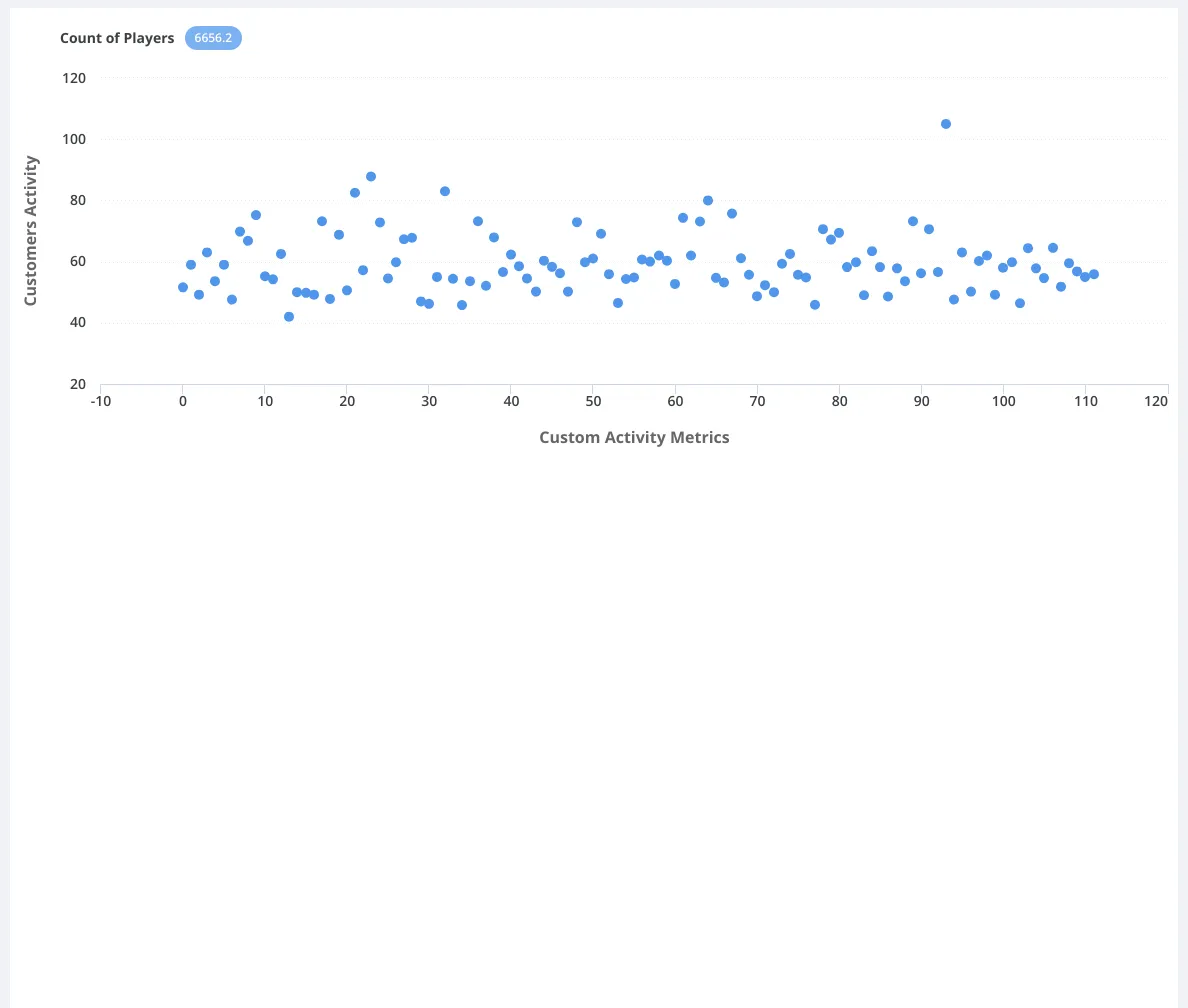
ScatterChart
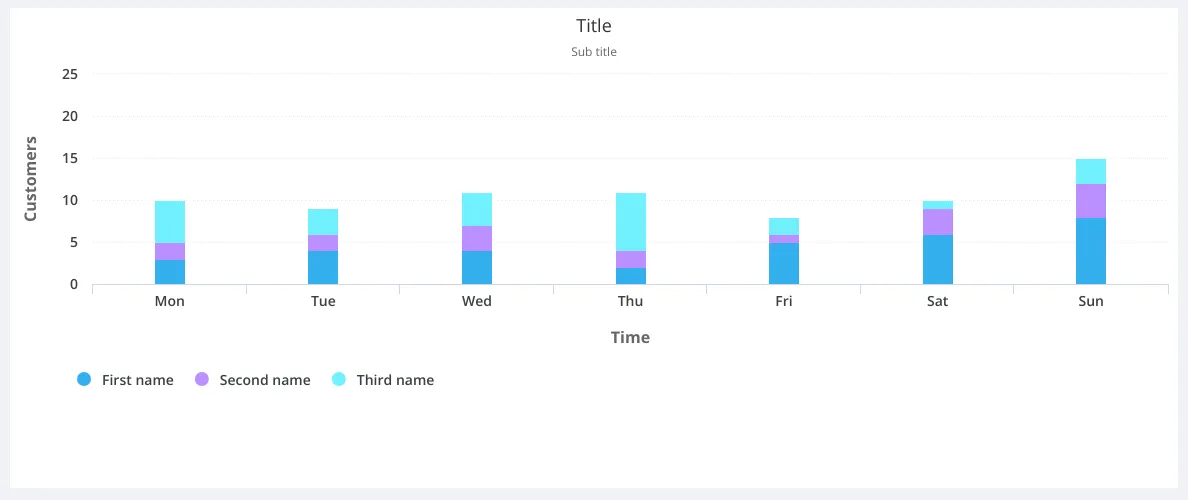
StackedColumnChart

Chart Loader